We’re always looking at how to improve data.govt.nz to meet you, our users’, needs. We want to know what’s working for you, what isn’t, and how we can keep improving your experience of finding and using data.
We’ve established a regular user survey as part of this work, with the first results out in December last year.
In response to requests for improved search on the site, for example, we implemented the following this year:
This blog post summarises the results from the most recent survey this year.
If you’d like to dive into the results in more detail, we publish the raw data here on data.govt.nz, and you can also have a look through an interactive prototype dashboard we’ve created for 2017, 2018 and a comparison of the two years – let us know what you think.
This year we had 22 respondents, down from 29 last year. We’re thinking of ways of increase this number, and would love to hear your suggestions.
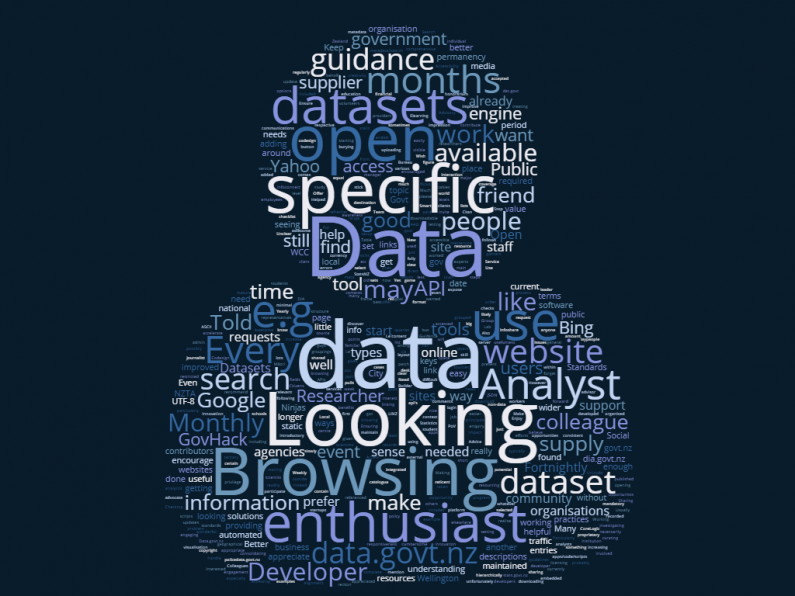
A larger proportion of respondents this year included ‘data enthusiast’ (30%) and ‘analyst’ (23%) when describing themselves. In total, there were 12 different kinds of user this year – we grouped the smaller numbers into ‘other’ in the dashboard, but the raw data has all of them.
41% classified themselves as more than one type of user, which shows that many people wear multiple hats when dealing with data, and that classification can also be quite subjective.
The main reasons people came to the site were looking for specific data (39%), browsing for specific data (33%) and looking for guidance on how to supply data (13%).
Most of the respondents visited data.govt.nz monthly – 41% visit every few months or so, and 27% on a monthly basis.
We asked people to rate various aspects of finding and using data and related information on data.govt.nz. We also asked why they chose their ratings – this qualitative data is really useful in helping us understand how to improve things.
Overall, half of respondents agreed they could find the data they were looking for, while just under half agreed they could find the standards and guidance they were looking for.
Some users wanted more information aimed at non-expert users, for example students and communities. This is definitely something we’re looking to develop in the new year.
Some said they wanted more datasets to be available, and more comprehensive lists of available data. Others pointed out that data.govt.nz could be a more comprehensive list of what’s available.
Respondents also pointed to more technical aspects, including the ability to support te Reo Māori, and having more developer-focussed tools.
The average rating for users’ last experience on data.govt.nz was 3.23 out of 5 – slightly down from last year’s 3.31.
Across all ratings, the most common comment was that people wanted more data at central and local government levels, and for data.govt.nz to be more comprehensive.
The average rating for how easy data.govt.nz made it to use datasets people found there was 3.14 out of 5, also down from last year’s 3.29.
APIs came up again, as did the need for better metadata. Respondents also suggested that the site’s structure could be improved, including making accessing e-learning materials easier. We’ll be working on this in the new year.
The average rating here for 7.36 out of 10, up from last year’s 6.76. People had a range of suggestions for how to improve this rating, including:
When we asked people for any final comments, the overall view was a positive one. Many users had very positive things to say (thank you!) – people told us they appreciated the work we’re doing, and having the opportunity to contribute.
People were also clear that we’re not there yet, and there’s still work to do.
We agree.
Firstly – thank you all so much for your input on the survey. We really appreciate it, and we’re taking it all on board as we develop next year’s work stream.
Our plans so far include:
Thank you to everyone who took part, and keep an eye out for more from us next year.
In the meantime, we’re always happy to hear your suggestions and feedback – you can get in touch with us at info@data.govt.nz.